VSM Calculator
Turn a table of process steps with cycle time, changeover, uptime, and inventory into
takt time, effective cycle time, lead time, PCE, and the bottleneck.
Current-state and future-state delta. Missing observations get [NEEDS GEMBA] instead of a guess.
Get the Definitions Right First
Confusing cycle time and takt time costs real money
A step can run faster than takt and the line can still miss customer demand if uptime, changeover, or another step is the constraint. The calculator compares effective cycle time (corrected for uptime and changeover) against takt, not the raw number.
Common Mistakes
The numbers that get VSMs wrong
[NEEDS GEMBA].How It Works
Give it a table. Get back the map's numbers.
Just two numbers the calculator can't proceed without: demand per day (or per shift) and the actual available production time net of breaks and planned maintenance.
A CSV with step name, cycle time, changeover, lot size, uptime %, and inventory before each step. If you describe steps in prose, the skill builds the table and shows it back for confirmation before running.
vsm_calc.py steps.csv --demand N --available-time-s N produces takt, per-step effective C/T, days of supply, totals, PCE, and the bottleneck call with the formulas spelled out.
Any step with no observed cycle time gets [NEEDS GEMBA: time this step]. Never a guess. The closing block of the report lists exactly which steps still need a stopwatch.
Pass a second CSV with the proposed future-state values and the report adds a delta table: what changes, by how much, and what the new PCE and lead time would be.
Sample Output
What a VSM Calc report looks like
Demand: 750 units/day · Available time: 25,200 s (7-hour shift) · Takt = 33.6 s/unit · One changeover per 750 units. Illustrative numbers, run through the shipped vsm_calc.py.
| Step | C/T (s) | C/O (min) | Uptime | Eff. C/T (s) | Inv. Before | Days of Supply | Hours of Supply |
|---|---|---|---|---|---|---|---|
| Blank | 28 | 15 | 92% | 31.7 | 420 units | 0.56 days | 3.9 h |
| Form | 31 | 45 | 88% | 39.3 ← bottleneck | 280 units | 0.37 days | 2.6 h |
| Pierce | 24 | 10 | 95% | 26.1 | 160 units | 0.21 days | 1.5 h |
| Trim | 19 | 8 | 97% | 20.2 | 90 units | 0.12 days | 0.8 h |
| Totals | 102 s processing | 950 units queue | 1.27 days | 8.9 h | |||
Form is the bottleneck at 39.3 s effective C/T vs. 33.6 s takt. The line is 17% over takt at this step. Cutting the 45-minute changeover to 20 minutes brings Form to 37.0 s, still 10% over takt, so Form's 88% uptime has to improve too. Note: Blank and Form cycle times come from a 14-day MES log; Pierce and Trim were observed (12 and 8 cycles). Confirm sample sizes before treating the bottleneck call as final.
Examples
Works for plants and clinics alike
Stamping line current-state: 5 steps, VSM walk data, 2-week MES cycle time log. Changeover is in seconds and lot size is the units made between changeovers. Future-state comparison after reducing the Form changeover.
step,cycle_time_s,changeover_s,lot_size,uptime_pct,inventory_before,source
Blank,28,900,750,92,420,MES log 14 days
Form,31,2700,750,88,280,MES log 14 days
Pierce,24,600,750,95,160,Observed 12 cycles
Trim,19,480,750,97,90,Observed 8 cycles
[NEEDS GEMBA: Inspect — no data yet]
Outpatient clinic visit flow. The skill mirrors the user's vocabulary: "units" becomes "patients," "changeover" becomes "turnaround," "days of supply" becomes "patients waiting."
step,cycle_time_s,changeover_s,lot_size,uptime_pct,inventory_before,source
Check-in,180,120,1,99,8,Observed 20 visits
Vitals,240,180,1,95,5,Observed 20 visits
Provider,900,600,1,85,12,EHR log 30 days
Checkout,120,60,1,98,3,Observed 20 visitsTakt in a clinic is demand-driven differently than a plant: "available time" is the clinic's scheduled hours, and "demand" is appointment slots filled. The skill flags where these differ from traditional manufacturing assumptions.
What you get
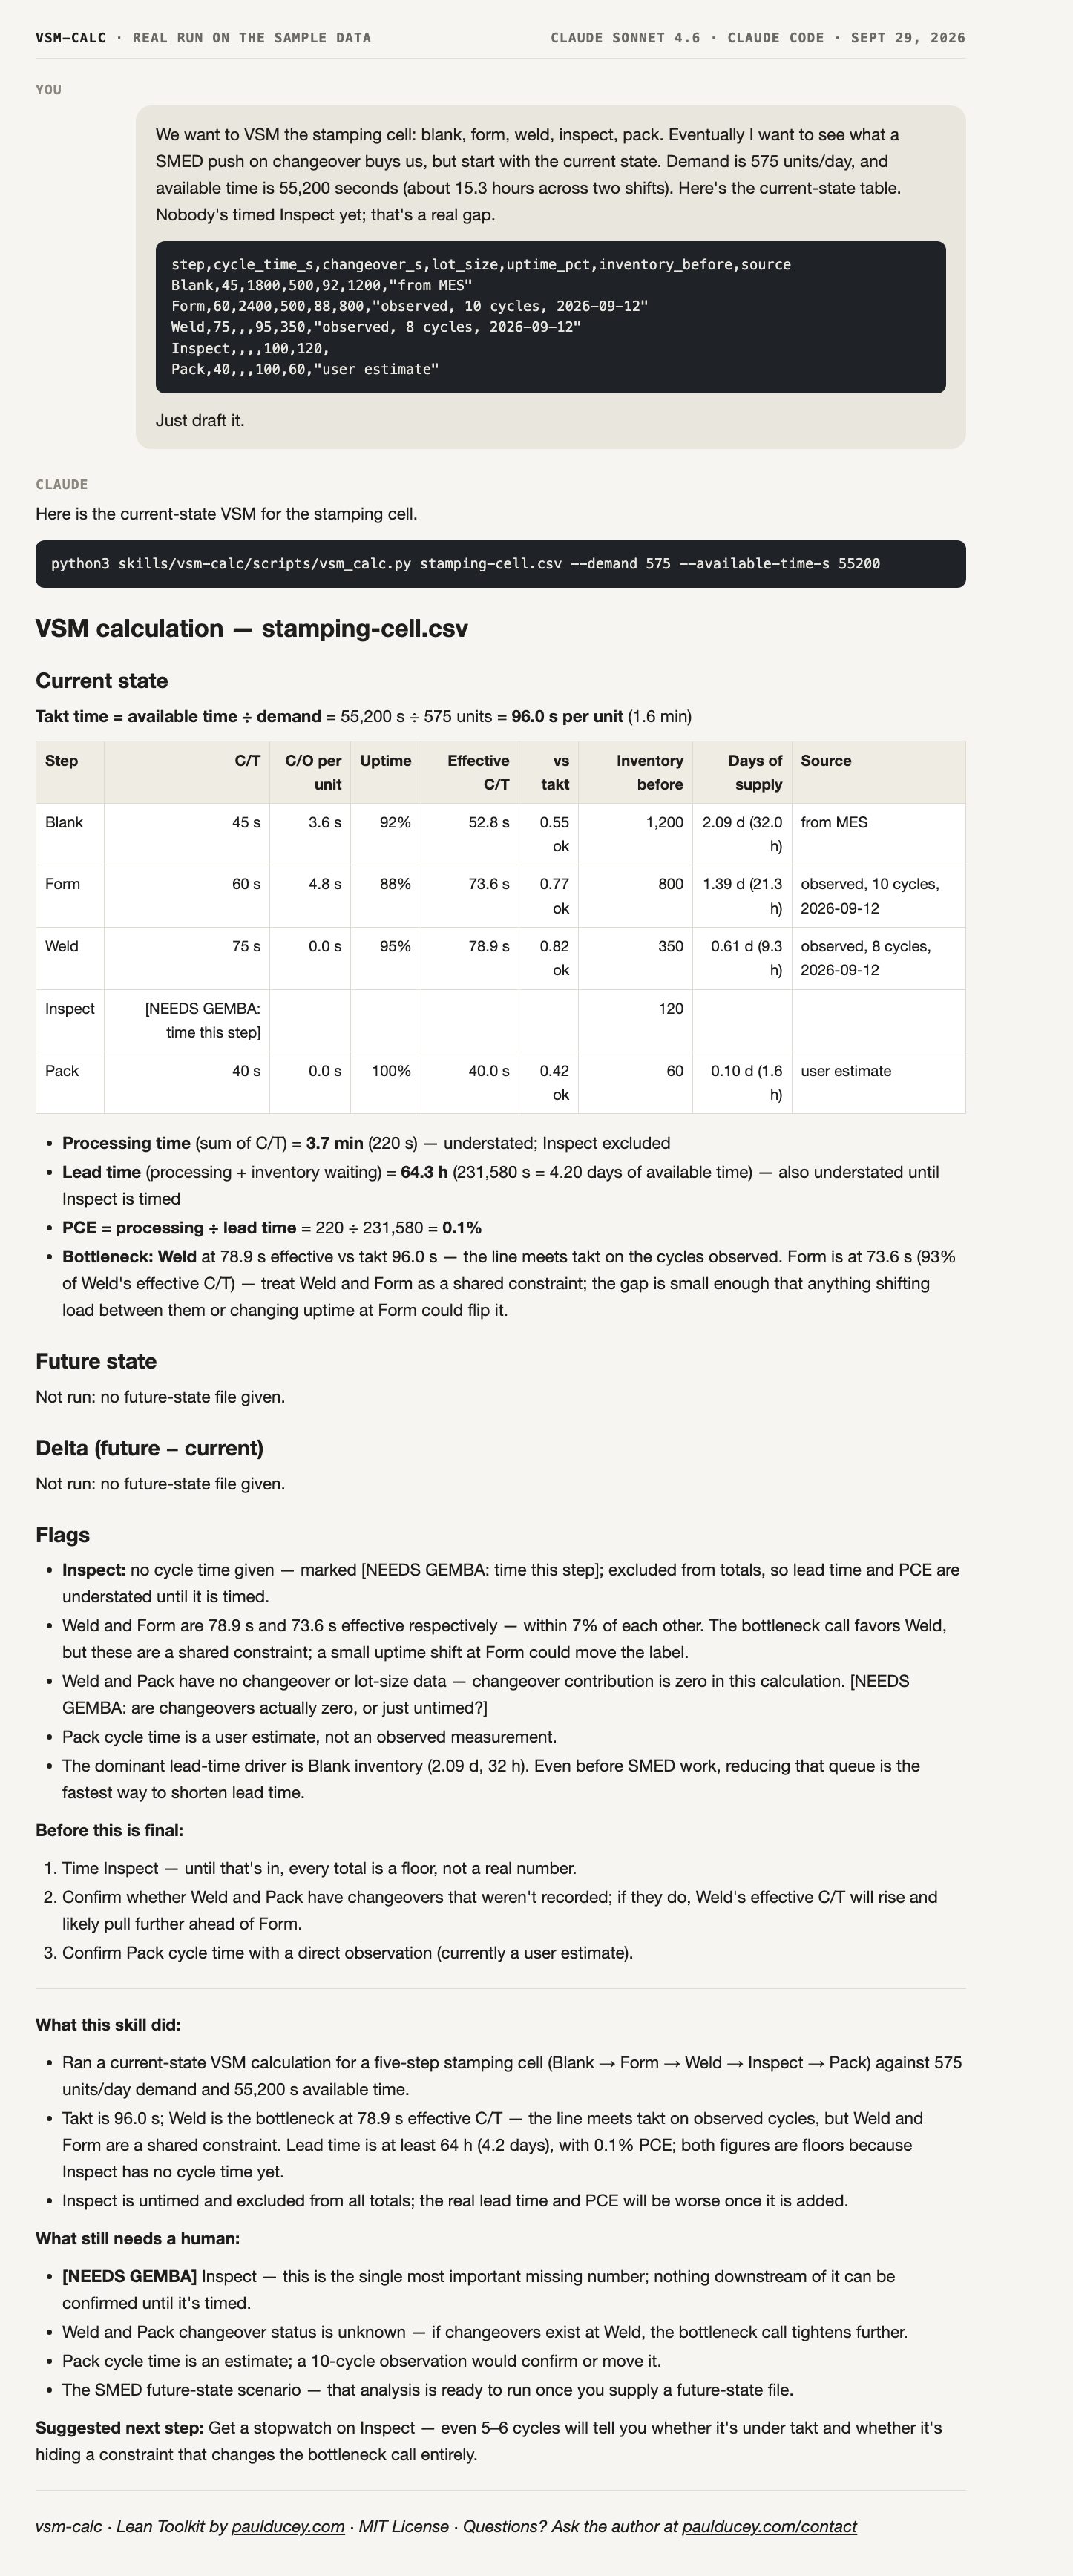
A real run on the sample data
Unedited output. The sample message at the top went to Claude Sonnet 4.6 (an earlier-generation model, so a newer one may word things differently) with this skill installed in Claude Code, which ran its calculator script, on September 29, 2026. Scroll inside the frame to read the whole reply.
Installation
Drop it in, describe your steps
mkdir -p .claude/skills and then move the unzipped vsm-calc folder into .claude/skills/.claude, and say "Run the vsm-calc skill on my_export.csv." Try the sample file first, stamping-current.csv, in resources/examples/.Related Skills
VSM leads to OEE or root cause next
Once you know which step is the bottleneck, OEE tells you how it's losing time. If a step's effective C/T is high because of recurring failures, root cause investigates why.