OEE from CSV
Calculate Availability × Performance × Quality = OEE and a Six Big Losses Pareto from any MES, SCADA, historian, or manual downtime export. Formulas shown with actual numbers. Never a bare OEE percentage without the loss breakdown.
OEE = Availability × Performance × Quality
The Problem
A bare OEE number tells you nothing to act on
Most teams can tell you their OEE. Almost none can tell you which loss category is driving it, or whether they're even calculating it correctly. The six traps below are almost universal, and this skill calls them out rather than letting them hide in the math.
Six Big Losses
Every downtime reason maps to a loss category
The skill keyword-maps downtime reason text into the six categories automatically. Anything that doesn't match goes into Unmapped. It is shown, not hidden.
How It Works
Draft-first. Formulas shown. Gaps flagged.
The skill runs the calculation immediately from whatever you paste or attach, then flags anything that needs your judgment before you use the number.
Any CSV from your MES, SCADA historian, or a manual downtime log. Auto-detects comma vs. tab delimiter, tolerates a messy header row and blank columns.
Availability, Performance, Quality, and OEE are computed using oee.py. If columns are missing, you get a clear list of what was found vs. what's still needed. Not a crash, not a guess.
Every formula shows the actual numbers substituted, not just the result. Six Big Losses table, downtime Pareto, and per-day/shift/line breakdown if those columns are present.
If there's no planned-vs-unplanned separation, if Performance goes over 100% (usually an ideal cycle time that is too slow, or counts logged outside run time), or if a loss can't be mapped, it's called out explicitly.
One command converts the report to a clean .docx ready to circulate: python3 .claude/skills/oee-from-csv/scripts/export_docx.py report.md
Examples
Manufacturing and healthcare both supported
A stamping line downtime log for one 480-minute shift. The period totals sit on the first row, and each row after that is a downtime event. The script auto-detects the delimiter and tolerates a messy header row.
planned_time_min,downtime_min,reason_code,ideal_cycle_time_min,total_count,good_count
480,42,Changeover,0.06,6800,6724
,18,Mechanical Failure,,,
,,Scheduled Break,,,Result from oee.py: Availability 87.5%, Performance 97.1%, Quality 98.9%, OEE 84.0%. The export has no planned/unplanned column, so all downtime is treated as unplanned, and the report says so. The Scheduled Break row has no minutes; if it were logged, it would be planned downtime and should not count as an Availability loss. The skill also asks whether 3.6 s per unit is the best-demonstrated rate and not an average, because an average flatters Performance.
MRI scanner scheduled-hours and scan count export. OEE terms map imperfectly onto healthcare, so the skill uses your vocabulary (scheduled hours, scans, turnaround) and includes an honest caveat.
scheduled_hours,downtime_hours,reason,scans_scheduled,scans_completed
8,1.2,Unplanned Maintenance,18,16
8,0.5,Patient No-Show,18,17
8,0,Routine Cleaning,18,18"Patient No-Show" is an external factor, not an equipment loss. The skill notes this may distort the OEE interpretation and recommends a separate no-show metric alongside OEE. The script also needs an ideal cycle time and a total count, which this export lacks, so the skill asks for them (for example, the ideal minutes per scan) before it calculates.
What you get
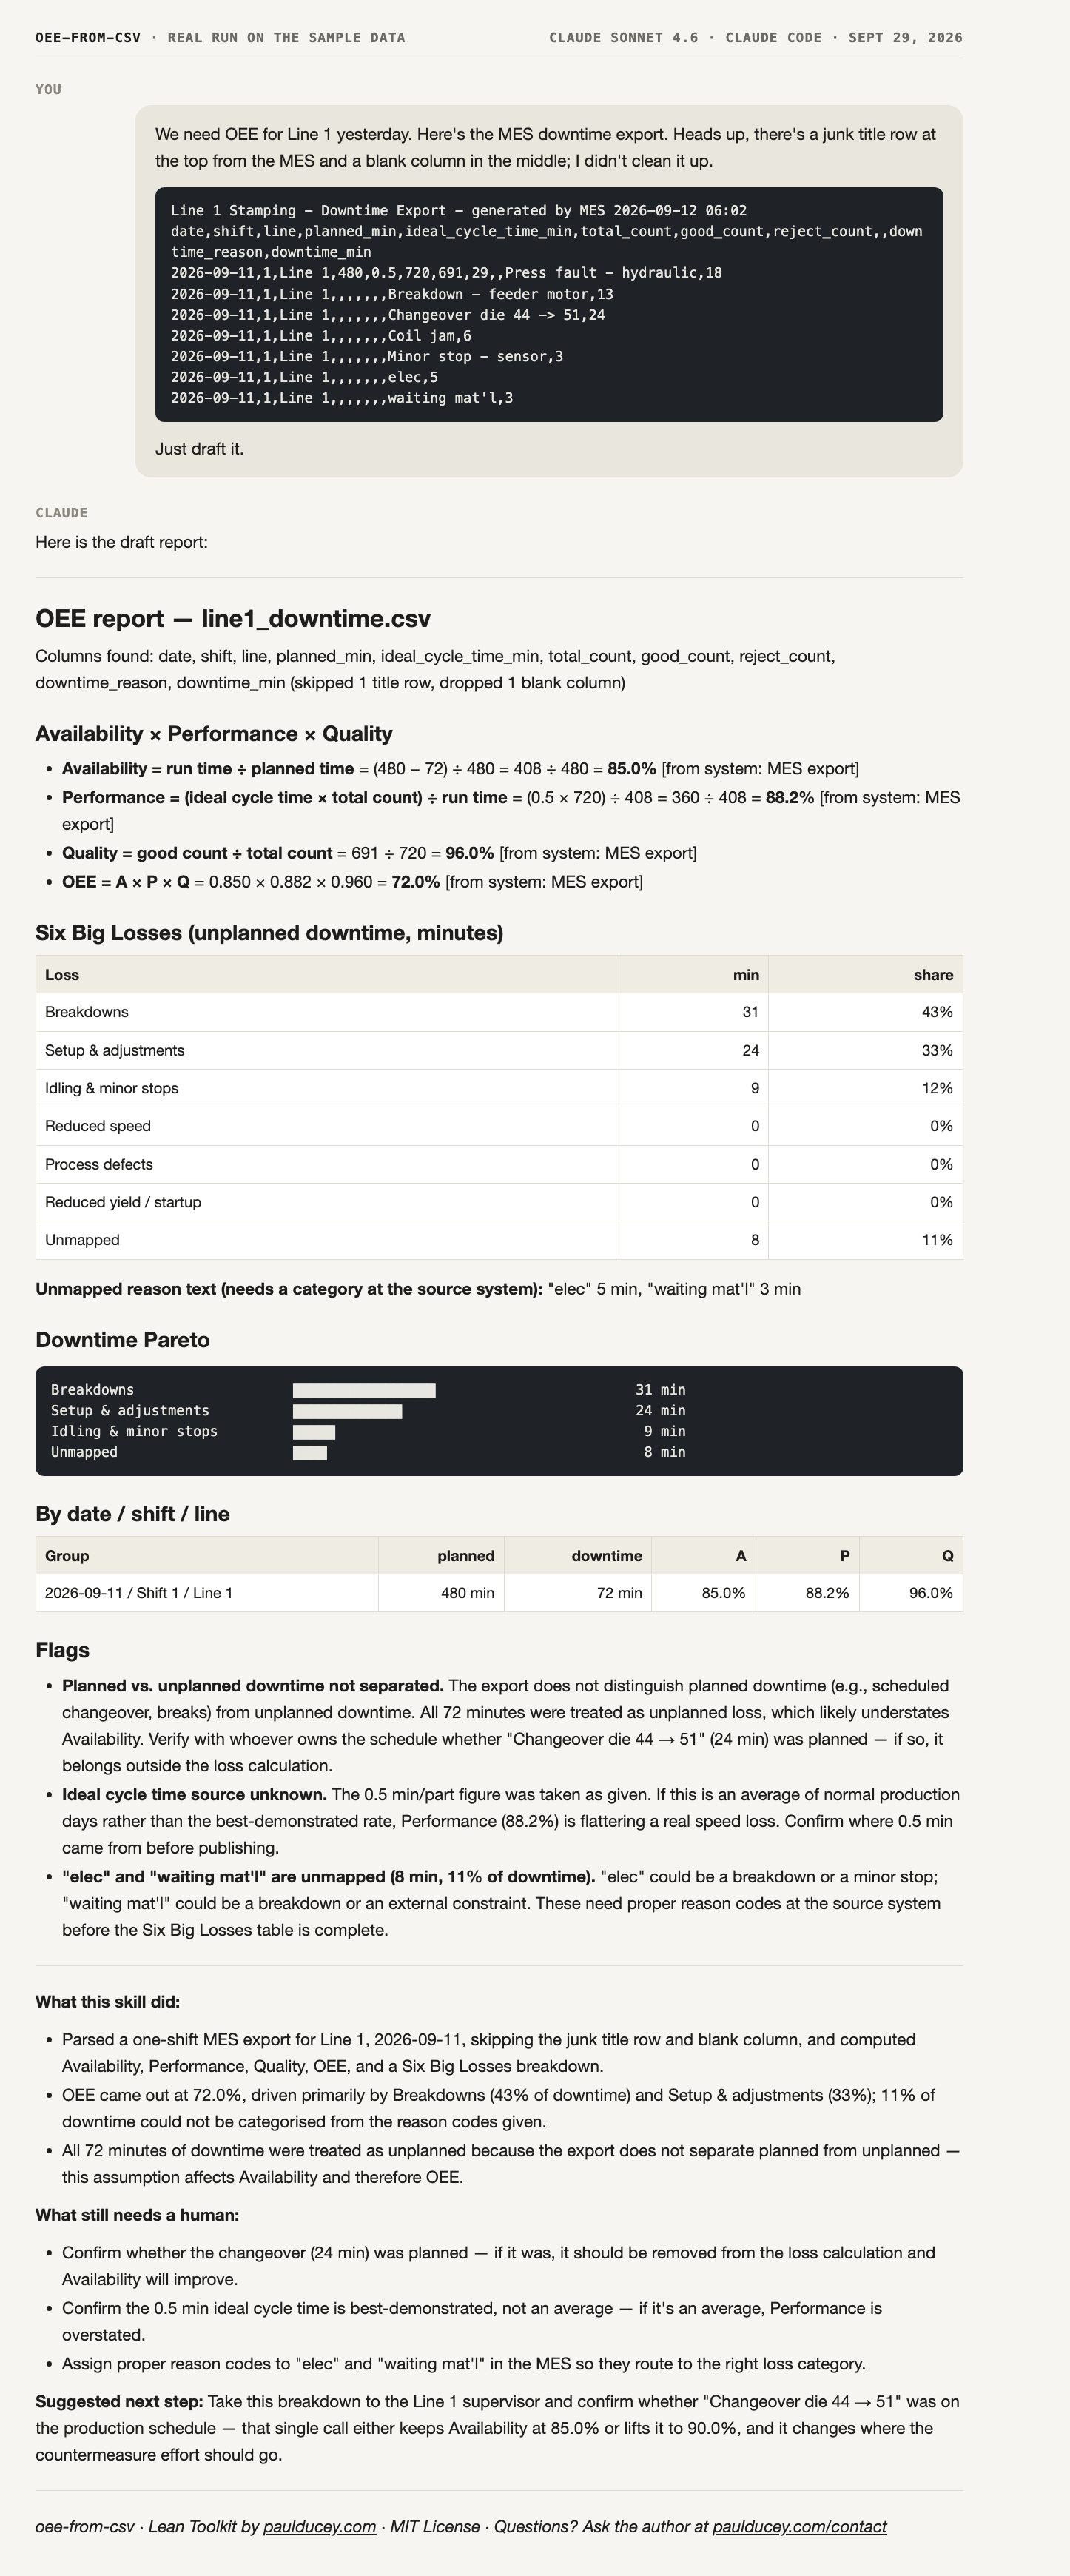
A real run on the sample data
Unedited output. The sample message at the top went to Claude Sonnet 4.6 (an earlier-generation model, so a newer one may word things differently) with this skill installed in Claude Code, which ran its calculator script, on September 29, 2026. Scroll inside the frame to read the whole reply.
Installation
Get it running in two minutes
mkdir -p .claude/skills and then move the unzipped oee-from-csv folder into .claude/skills/.claude, and say "Run the oee-from-csv skill on my_export.csv." Try the sample file first, line1_downtime.csv, which is in resources/examples/.This skill works with Claude Code (Anthropic's CLI). It is not a browser extension or SaaS tool. It's a folder you add to your project. Get Claude Code →
Related Skills
When OEE leads somewhere else
A high Six Big Losses bucket in Breakdowns suggests root-cause work. A large gap between scheduled and run time warrants a VSM to see the full picture.