Control Chart Interpreter
A control chart tells you whether process variation is normal noise or a real signal. Acting on noise makes things worse. Missing a signal lets a defect escape. This skill reads your chart data correctly: signals, Cp/Cpk, and the response protocol.
Two Types of Variation
Common cause vs. special cause: the decision that changes everything
Every data point on a control chart is variation. The question is not whether variation exists. It always does. The question is whether the variation is the expected noise of the system, or a signal that something has changed. The answer determines whether you act or leave the process alone.
Never adjust a process in statistical control. Every adjustment to a process with only common-cause variation adds variation instead of removing it. The operator who "corrects" a value that is in control but looks high is making the next measurement worse on average. This is Deming's funnel experiment made real. The skill explicitly flags when data is in control and tells you to leave it alone.
Detection Rules
The four rules that catch the most
These rules come from two sources. The Western Electric Statistical Quality Control Handbook (1956) set out the zone rules, including a single point beyond 3σ. Lloyd Nelson's 1984 set of eight tests added the run of nine, the run of six rising or falling points and the 14 alternating points. Practitioners often call the whole set "Western Electric rules," and the skill's report uses that heading. The four below are the ones it applies by default. The other four of Nelson's tests pick up smaller shifts but raise the false-alarm rate, so use them on purpose, not by default.
A single point outside the upper or lower 3-sigma control limit. The probability of this occurring from common cause alone is less than 0.3%. Stop and investigate. Contain any suspect output produced since the last in-control point.
The process mean has shifted. All nine points are in control individually, but the run indicates a sustained change in the process level. Common causes: material lot change, new operator, tooling wear, environmental shift.
The process is moving steadily in one direction. Common causes: tool wear, gradual contamination buildup, temperature drift, operator fatigue over a long shift. Acting early prevents a Rule 1 violation.
Two processes or sources are competing to produce the output: alternating machines, alternating operators, alternating suppliers, alternating cavities. The pattern looks stable in aggregate but is not. Stratify the data by source.
Process Capability
Cp vs. Cpk: potential vs. actual
A control chart tells you whether the process is stable. Capability indices tell you whether the stable process fits inside the specification limits. Both questions must be answered, because a stable process can still be incapable of meeting spec.
| Cpk Range | Verdict | Interpretation | Action |
|---|---|---|---|
< 1.00 |
Not capable | The nearer specification limit is inside 3 sigma of the process mean, so defects are expected. | Reduce variation or move the mean. Both may be needed. |
1.00 – 1.33 |
Marginal | Capable under ideal conditions but with little margin. Any shift or drift produces defects. | Tighten controls. Increase sampling frequency. Set action limits inside control limits. |
1.33 – 1.67 |
Acceptable | 1.33 is a common minimum for existing processes. Adequate with normal monitoring. | Maintain controls. Routine monitoring sufficient. |
> 1.67 |
Strong | 1.67 is a common minimum for new safety-critical processes. Confirm the process is stable, with 100 or more readings, before considering less inspection. | Document and protect the process. Reduce sampling only once stability is confirmed. |
A process can have Cp = 1.60 and Cpk = 0.85. This means the process spread is narrow enough to fit inside the spec, but it is off-center, so one tail is outside the limit. The fix is centering, not variation reduction. The skill always reports both and interprets the difference explicitly.
Special Cause Response
What to do when a signal fires
A signal is not an alarm. It is a question: what changed? The three-step protocol is the same regardless of which rule fired.
How It Works
Paste your data. Get the signals and the capability.
A column of values from any measurement system: CMM, MES log, lab results, manual gauge readings. The skill identifies the chart type (I-MR for individual measurements, X̄-R for subgroups) from the data structure.
UCL, LCL, and centerline are computed from the data using standard SPC constants. If you provide historical control limits from a prior stable period, those are used instead, and the skill will note which was applied.
All four rules are evaluated against the data. Signals are reported with the exact point index, the rule that fired, and the specific pattern. No signal: the skill explicitly says the process is in control and tells you to leave it alone.
Provide USL and LSL and the skill calculates Cp and Cpk with formulas shown. The interpretation and recommended action are included. If spec limits are absent, the skill reports capability as not calculable, not assumed.
If a signal is detected, the output includes the three-step response protocol tailored to the specific rule and the process described. If no signal: a clear statement that the process is in statistical control.
Examples
Manufacturing dimensions and healthcare process times
CNC turned bore diameter, 25 consecutive parts. Individual measurements with USL = 25.050 mm and LSL = 24.950 mm. I-MR chart used for individual observations.
measurement_mm: 24.998, 25.003, 24.997, 25.001, 25.004, 24.999, 25.002, 25.006,
                25.008, 25.012, 25.015, 25.018, 25.022, 25.026, 25.031, 25.029,
                25.033, 25.028, 25.031, 25.034, 25.038, 25.041, 25.044, 25.047, 25.049

USL: 25.050 LSL: 24.950Rule 3 fires at point 11: six points in a row rising (points 6 to 11). With the limits set from the first nine parts (centerline 25.002 mm, UCL 25.013 mm, LCL 24.991 mm), Rule 1 fires at point 11 too, because 25.015 is above the UCL. The process is drifting toward the USL, and the last in-control point is 10. The last reading, 25.049 mm, is only 0.001 mm under it. Contain output from point 11 forward pending investigation. Causes to check for a one-way drift like this: tool wear, thermal growth of the machine, a drifting tool offset. No Cpk is reported. Capability only means something on a stable process, and this one is not stable, so the skill defers it until the special cause is found and removed.
Lab result turnaround time (minutes from order to resulted) on an I-MR chart. 30 consecutive results, illustrative numbers. No specification limit. Monitored for stability only.
tat_minutes: 45, 46, 41, 39, 38, 41, 38, 36, 42, 41, 43, 38, 41, 41, 36,
             43, 42, 49, 42, 41, 45, 42, 44, 40, 42, 44, 43, 41, 38, 42

No USL/LSL provided — stability monitoring only.None of the four rules fires. All 30 points are within 3σ of the centerline (mean: 41.5 min, UCL: 49.6 min, LCL: 33.3 min, from the average moving range of 3.07 min). No runs, no trends, no alternating pattern. The process is in statistical control. Do not adjust it. If the average TAT of 41.5 minutes is unacceptable, that is a system-level problem requiring a process improvement, not an adjustment to the current process.
What you get
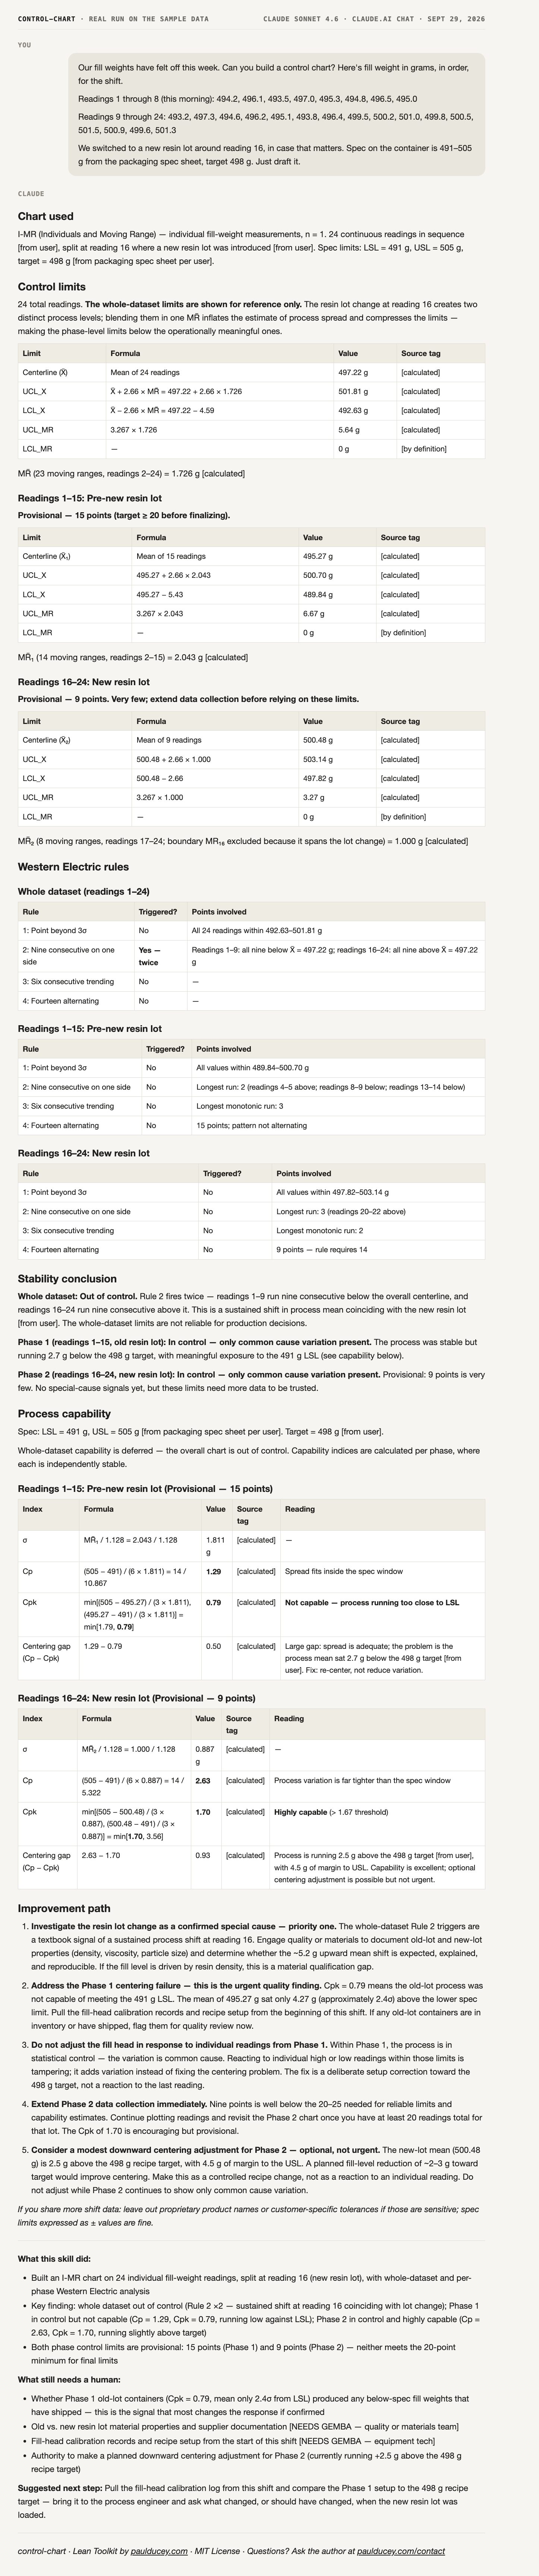
A real run on the sample data
Unedited output. The sample message at the top went to Claude Sonnet 4.6 (an earlier-generation model, so a newer one may word things differently) with this skill pasted in, the same way the steps below show, on September 29, 2026. Scroll inside the frame to read the whole reply.
Installation
Paste your data and say "read the control chart"
resources/examples folder.Related Skills
Control charts connect to OEE, FMEA, and process health
An out-of-control signal on a critical characteristic is an OEE quality event. FMEA predicts which characteristics need control charts. Process health reporting aggregates signal status across characteristics.